This article was previously published in print on Dec. 05, 2023.
Hamline is changing. This moment of change is not new and not done, but in light of President Miller’s retirement, The Oracle took this opportunity to briefly review the past decade of publicly available academic and financial data.
Although we consider these data in the context of Miller’s presidency, universities are complex, slow-moving things, and we should be wary to interpret these changes as being caused by any one decision or individual. Still, these data describe Hamline during a time when Miller’s administration was answerable for the state of the university.
 Data Source: IRS Form 990
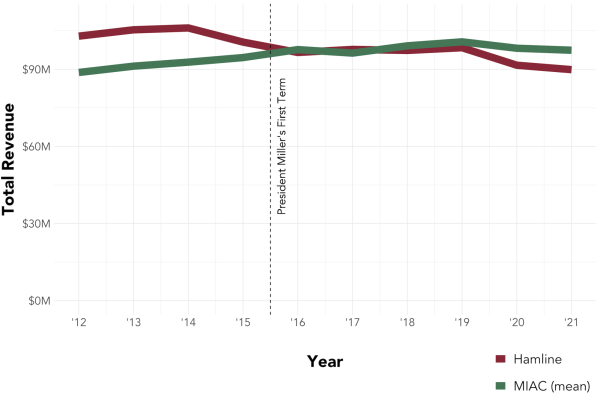
In comparison with an average of all other colleges and universities in the Minnesota Intercollegiate Athletic Conference (MIAC), Hamline’s Total Revenue — a measurement of all money flowing into the university before accounting for expenses — has declined since 2012. That decline has coincided with a gradual decrease in the number of students enrolled each year: a trend which preceded Miller’s presidency.
Data Source: Hamline’s posted bulletins
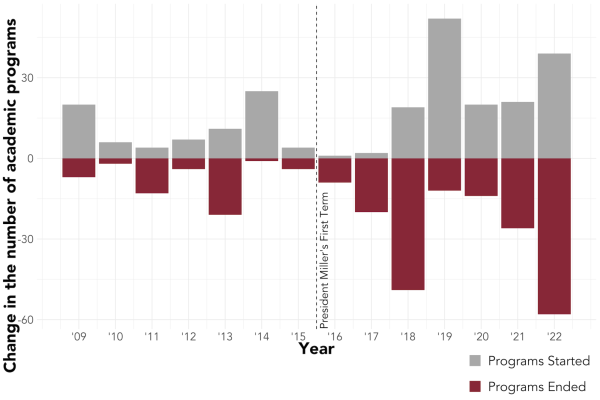
Returning students and faculty at Hamline have undoubtedly noticed changes in the available academic programs over the past few years. Many current students are in the process of completing minors which are no longer offered to incoming first years or will no longer be offered next year. Through faculty turnover and top-down “rightsizing” efforts — including multiple program reviews intended to align the available programs with demand in response to a shrinking university budget — the program changes have had a personal impact for many on campus, but the change can be difficult to measure.
Each year, Hamline publicizes a list of its academic programs. By comparing each of those lists to the year before, we can see that the instability of academic programs has been growing since 2015.
Data Source: IRS Form 990
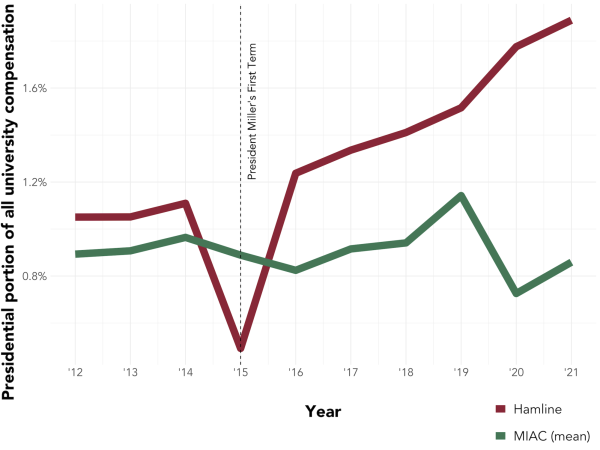
Because the MIAC includes a wide range of student class sizes and financial endowments, it is difficult to make fair comparisons between presidential salaries. Rather than directly comparing the dollar amount paid to each president, we compared the portion of all staff and faculty salaries paid at each school that went to their respective presidents: the “Presidential Salary Portion” (PSP).
According to Hamline’s tax filings, President Miller’s pay was substantially lower during her first term. It is unclear what factors contributed to that exceptional year, but in all other terms, the Hamline president has been paid a larger portion of the school’s salaries than the average in the MIAC. While the MIAC average PSP has stayed around 0.9% with a sharp decrease at the start of the COVID-19 pandemic, Hamline’s PSP has consistently risen with each year since the beginning of Miller’s presidency.

Data Source: National Center for Education Statistics’ Integrated Postsecondary Education Data System (IPEDS)
Hamline is not alone in having a shrinking student body in recent years. Still, a comparison with the MIAC shows that the same is not true for all nearby schools: on average the number of students in MIAC schools stayed relatively stable.
When Hamline’s population decreased, its presence in the MIAC decreased, too.
Percentage of all students in the MIAC at each constituent school